See what you’ll get
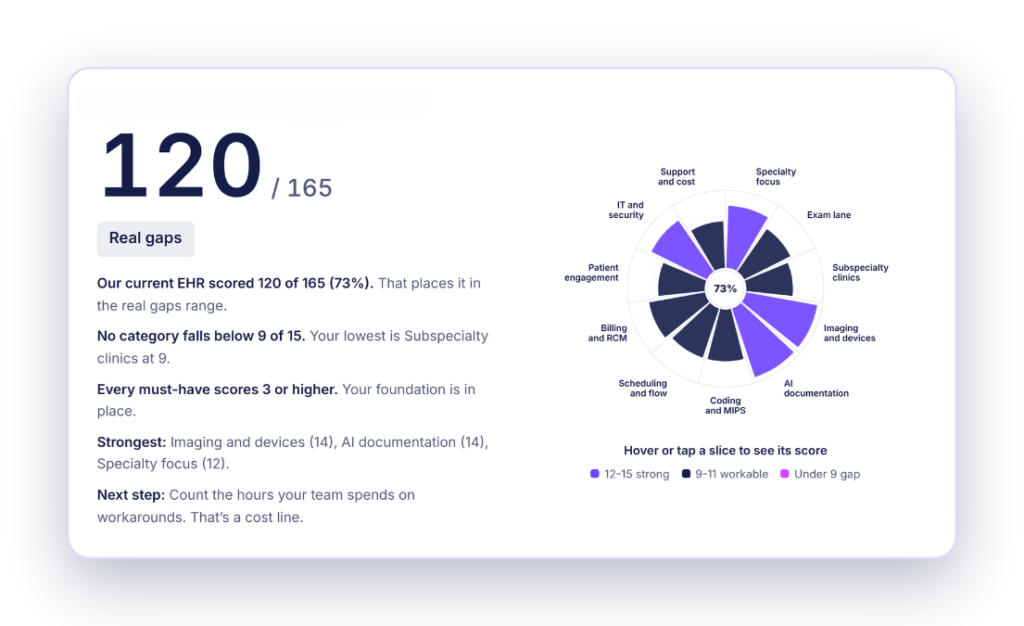
Your scorecard shows your total out of 165, a gap map across all 11 categories, any must-have gaps, and the questions to ask in your next demo.
Sample scorecard. Yours will reflect your own scores.
Score your current platform, and up to two vendors, on the 33 things that matter in an eye care practice. Your scorecard maps every gap and shows exactly what to ask in your next demo.
Best in KLAS 2024, Ophthalmology EMR | 1 Specialty | 8 Solutions | 100% Dev Spend | 0 Compromises
Start with your current system. Add vendors you’re evaluating to compare them side by side (optional). You’ll score every system on each item, all on the same screen.
Add any revenue cycle numbers you have. They turn “it feels slow” into a cost you can put in front of your partners. Don’t know one? That’s a finding too.
Rather talk it through? Book a personalized demo.
Your scorecard shows your total out of 165, a gap map across all 11 categories, any must-have gaps, and the questions to ask in your next demo.
Sample scorecard. Yours will reflect your own scores.
The scorecard rates 33 items across 11 categories. Each category is scored out of 15, and anything below 9 is flagged as a priority gap.
1. Specialty focus and vendor commitment: how much of the vendor’s development and validation is dedicated to eye care.
2. The exam lane: bilateral documentation, and technician workup that flows into the physician’s note without re-entry.
3. Subspecialty clinics: native glaucoma, retina, cataract, cornea, oculoplastic, and pediatric workflows.
4. Imaging and diagnostic devices: native DICOM, automatic device import, and side-by-side image comparison.
5. AI documentation: built-in dictation and scribing, with provider review and privacy controls.
6. Coding, MIPS, and quality reporting: codes and MIPS measures captured during the exam, plus IRIS Registry integration.
7. Scheduling and patient flow: eye care appointment types, with scheduling, charting, and billing in one record.
8. Billing and revenue cycle: claim scrubbing, eligibility checks, automatic ERA posting, and denial management.
9. Patient engagement: reminders, digital intake and consent, and upfront cost estimates.
10. Deployment, IT, and security: hosted or on-premise options, hardware compatibility, HIPAA, and a signed BAA.
11. Implementation, support, and total cost: a written implementation plan, ophthalmology-trained support, and all costs in writing.
Score every vendor on the same criteria, using the same scale, and score your current system first as a baseline. The Optivate scorecard rates 33 items across 11 ophthalmology-specific categories, from 1 (missing) to 5 (native), and gives you questions to ask in each vendor’s demo. It works best when physicians, technicians, administrators, and billing staff score together, since each group sees a different part of the system.
Look for workflows built for eye care, not a general EHR adapted to it. Key areas include bilateral exam documentation, native subspecialty templates for glaucoma, retina, and cataract, direct integration with OCT and other diagnostic devices, MIPS measures captured during the exam, and scheduling and billing connected to the chart. The real test is whether a feature works natively: if staff have to explain the workaround, it isn’t.
Your scorecard shows a total score out of 165, an overall rating, a visual gap map, and a category breakdown. Categories scoring below 9 of 15 and must-have items scoring 2 or below are flagged, along with specific questions for your next demo. If you score up to two vendors, you get a side-by-side comparison. If you enter revenue cycle numbers, you see how they compare with industry benchmarks.
Yes, it’s free and takes about 10 minutes. Your scorecard appears on screen when you submit, and you can print it or save it as a PDF. Progress is saved in your browser, so you can come back later on the same device. Optivate receives your contact details, current system name, scores, and any revenue cycle numbers you enter. Vendor names and vendor scores stay in your browser. Please don’t include patient information.